
Five modules, one hub, shared definitions.
Each module of AdiHub, the Angelsee Data Intelligence Hub, answers the questions one set of offices asks most. Turn on the modules your institution needs; they share data, roles and metric definitions.
Research Administration
Which sponsored awards need attention before they end?
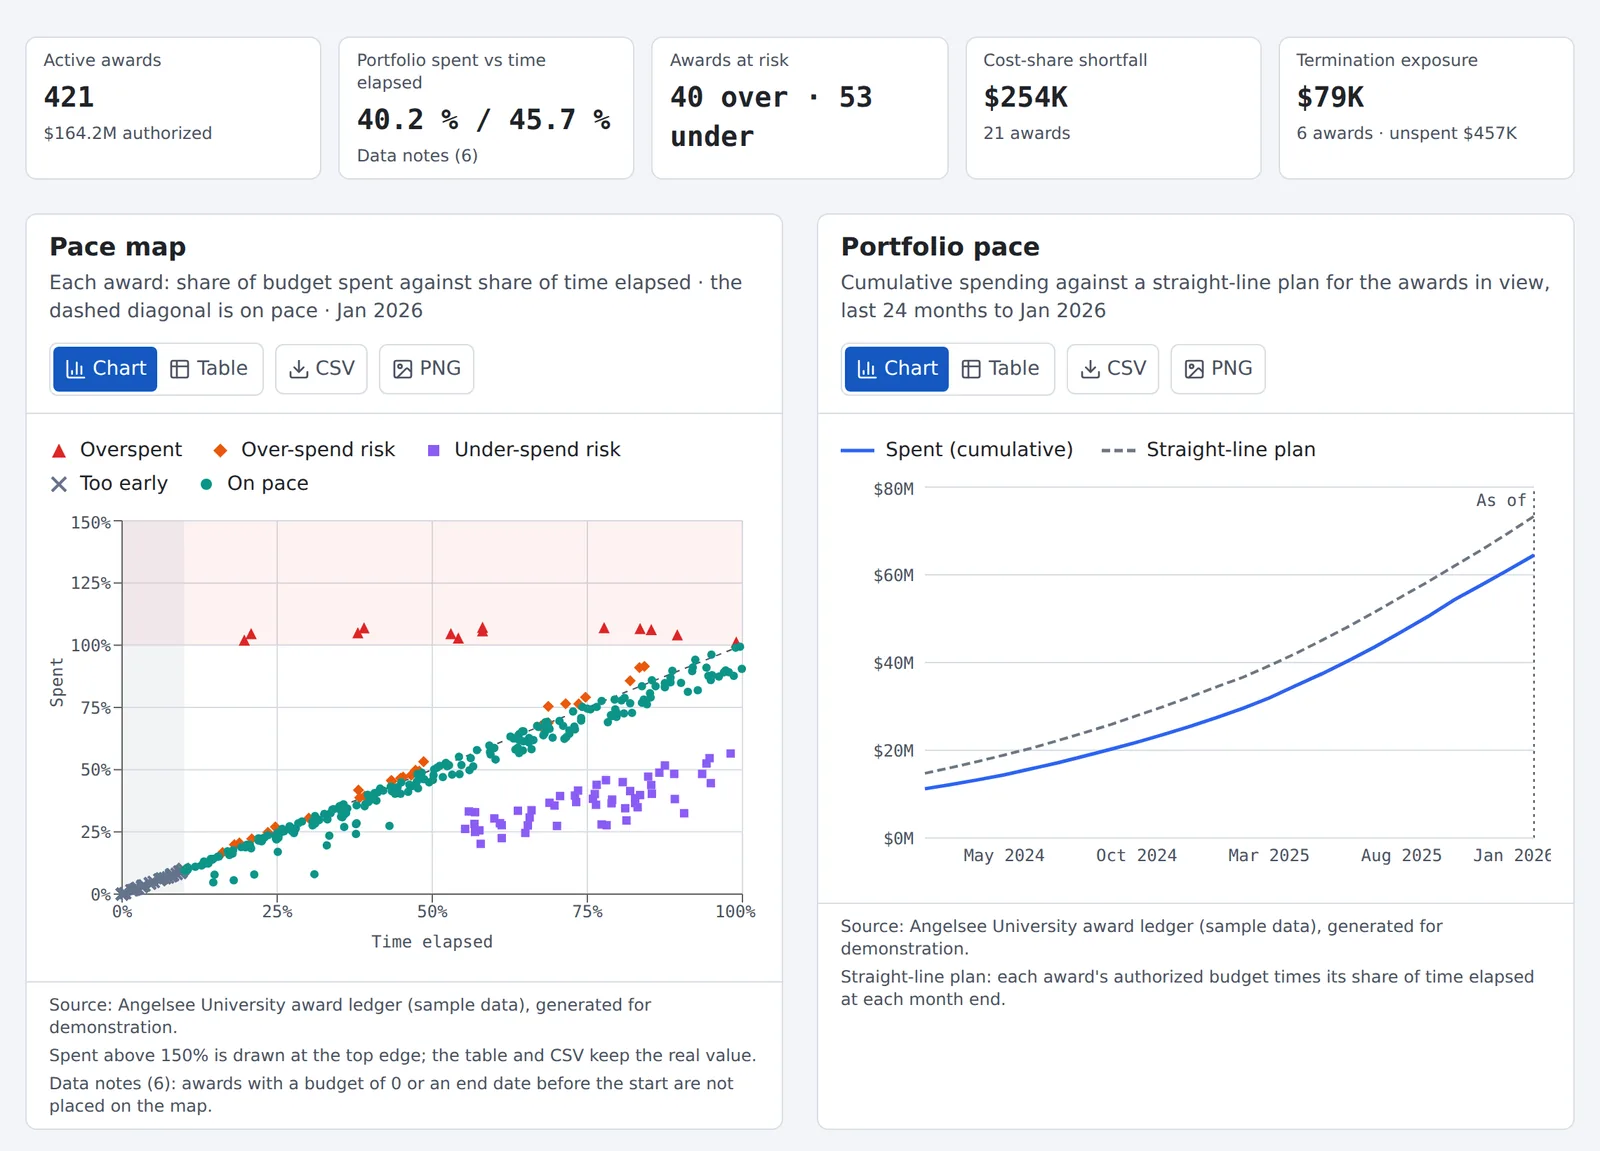
- Award Burn Rate: every award's share of budget spent against its share of time elapsed
- Awards likely to end over or under budget, ranked by the dollars involved
- Cost-share shortfalls and exposure on stopped or terminated awards
- Drill-down from a college to a department to a single award
- Used by
- Vice president for research, sponsored programs, post-award, department administrators
- Data
- Your ERP or grants ledger and award records, refreshed on the schedule you set.
 AdiHubAward Burn RateSample
Student Success & Retention
Where are students leaving, and which ones need a follow-up now?
- Retention and graduation by entering cohort, program and student group
- Gaps between groups, with groups under 10 students shown as “Fewer than 10”
- Students with two or more early-alert signals, and whether each was followed up
- Your rates beside a peer group from public IPEDS data
- Used by
- Provost, student success, advising, institutional research
- Data
- Your student information system and learning management system; IPEDS for peers.
AdiHubRetention & Early AlertsSample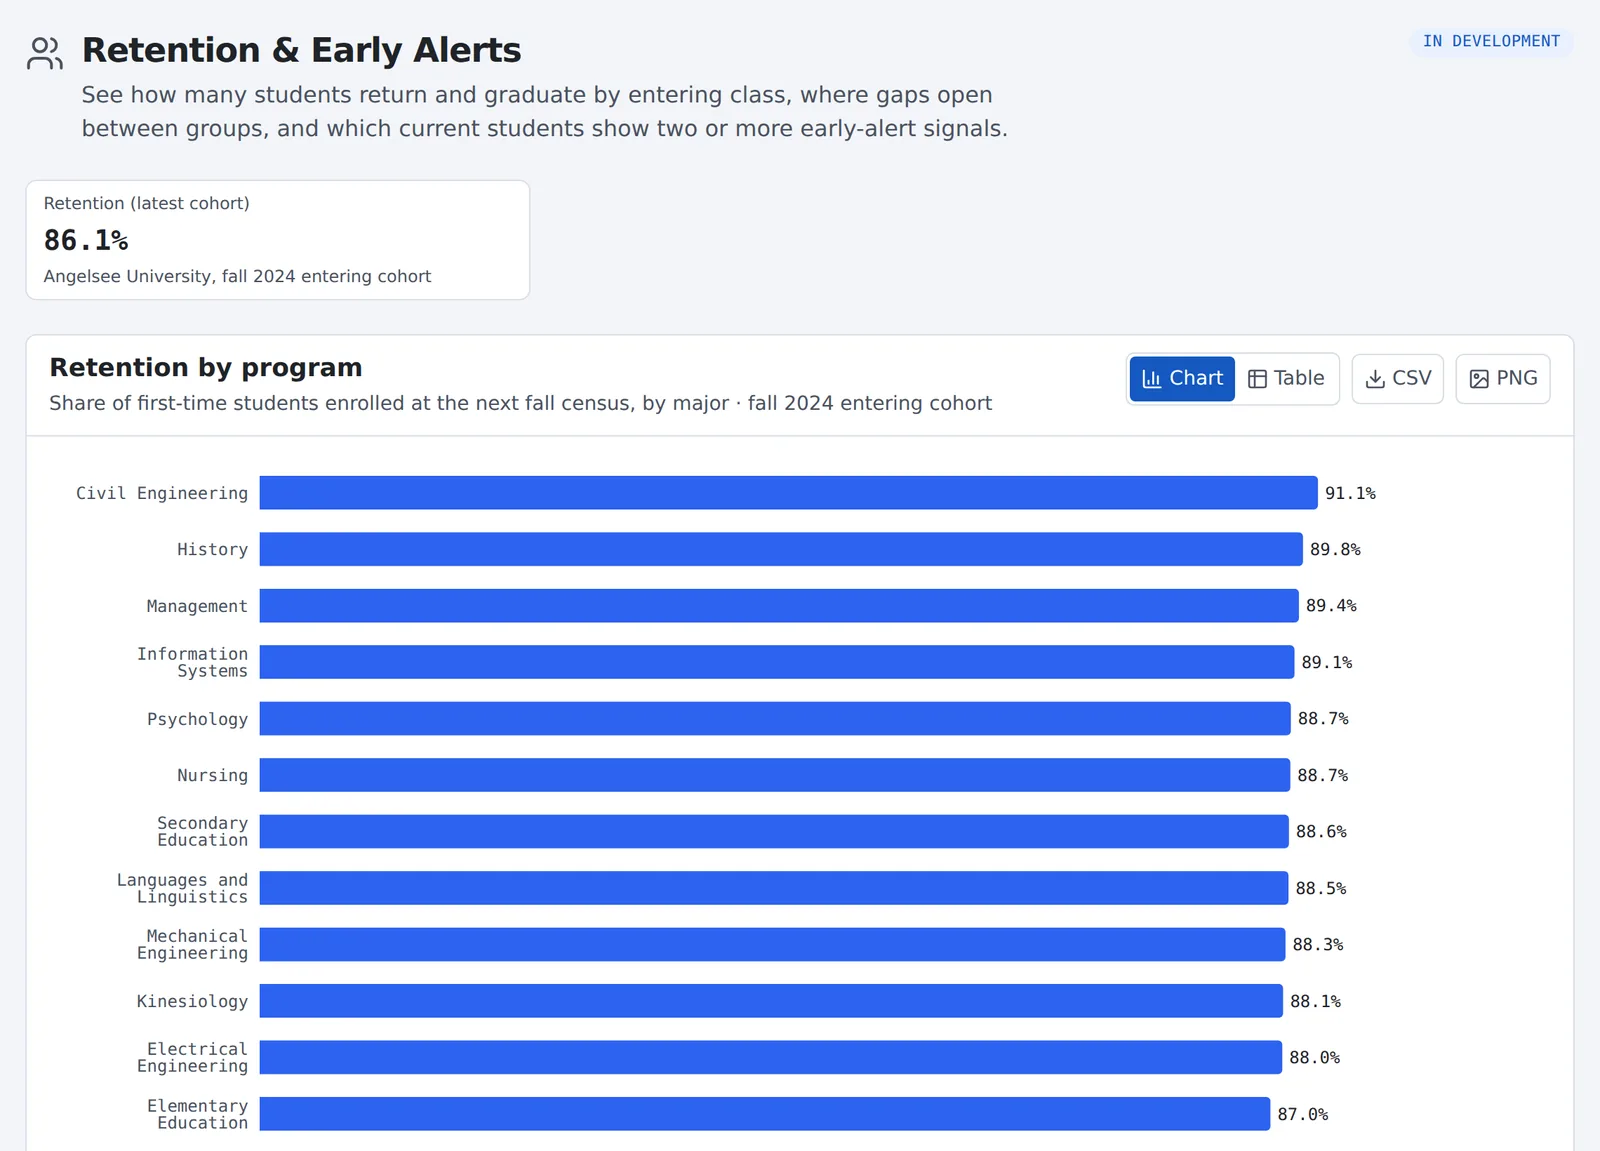
Budgeting & Forecasting
What does next year’s budget look like under different enrollment and pricing scenarios?
- Multi-year net tuition revenue forecast with enrollment, price and discount scenarios
- Financial-health indicators such as days cash on hand
- Monthly budget to actual by unit, with variance explanations
- Position control: budgeted and filled positions by unit
- Used by
- Chief financial officer, budget office, provost, board finance committee
- Data
- Your general ledger and ERP, student information system and financial-aid data.
AdiHubNet tuition revenue forecastDesign previewView as table
| Year | Actual | Decline | Base | Growth |
|---|---|---|---|---|
| FY23 | 41.2 | – | – | – |
| FY24 | 42.0 | – | – | – |
| FY25 | 42.9 | – | – | – |
| FY26 | 43.5 | – | – | – |
| FY27 | – | 43.1 | 44.3 | 45.2 |
| FY28 | – | 42.6 | 45.0 | 46.6 |
| FY29 | – | 42.2 | 45.8 | 48.0 |
| FY30 | – | 41.9 | 46.5 | 49.3 |
Federal Accountability Reporting
Which programs could fall short of federal outcome standards, and what is due when?
- Program earnings compared with the federal earnings thresholds, with programs at risk flagged
- An estimate for every program from public College Scorecard data
- IPEDS submission readiness and checks across survey components
- One calendar of federal reporting deadlines, including the program-level reporting coming in 2027
- Used by
- Institutional research, financial aid, registrar, compliance
- Data
- Public College Scorecard and IPEDS data; your own program and enrollment records for the full view.
AdiHubProgram earnings exposureDesign preview| Program | Median earnings | Threshold | Status |
|---|---|---|---|
| NursingBachelor’s | $68,900 | $36,800 | Above |
| Computer ScienceBachelor’s | $62,300 | $36,800 | Above |
| Business AdministrationBachelor’s | $46,200 | $36,800 | Above |
| PsychologyBachelor’s | $35,100 | $36,800 | Below |
| Graphic DesignBachelor’s | $33,900 | $36,800 | Below |
| Medical AssistingCertificate | $27,400 | $30,100 | Below |
Strategic Planning and Metrics
Are we on track against our strategic plan, and how do we compare with our peers?
- A board and cabinet scorecard drawn from the other modules, with targets and trends
- The indicators accreditors watch, computed from the same public data they use
- Peer group selection and benchmarking
- Strategic-plan goals with owners, targets and progress
- Used by
- President, cabinet, board, institutional effectiveness, accreditation liaison
- Data
- The other AdiHub modules, plus public IPEDS data for peers and accreditor indicators.
AdiHubBoard scorecardDesign preview- First-year retention78.4%Target 80.0% Behind
- Six-year graduation61.2%Target 60.0% On track
- Net tuition revenue$43.5MTarget $44.0M Behind
- Fall enrollment (FTE)2,846Target 2,800 On track
Public federal data, with its source on every panel.
The public benchmarks use only federal data that anyone can download. Each panel names its survey, component, data year and whether the release is provisional or final. Fictional demonstration institutions never appear in them.
- Peer BuilderWorking previewPick any institution and a peer group, then compare enrollment, retention, graduation, admissions and spending per student.NCES IPEDS · 3,797 degree-granting institutions
- R&D RankingsWorking previewSee how universities rank on research spending, how one university’s spending has changed, and where its research money comes from.NSF NCSES HERD Survey · FY2019–FY2024
- Federal Awards & Burn RateIn designFor any university: how fast reported outlays on its federal research awards are running against obligations and time.USAspending, NIH RePORTER, NSF awards, Federal Audit Clearinghouse
- Program Earnings EstimateIn designAn estimate of each program’s earnings against the federal thresholds, labelled as an estimate, not the Department of Education’s determination.U.S. Department of Education College Scorecard
AdiHubR&D RankingsPublic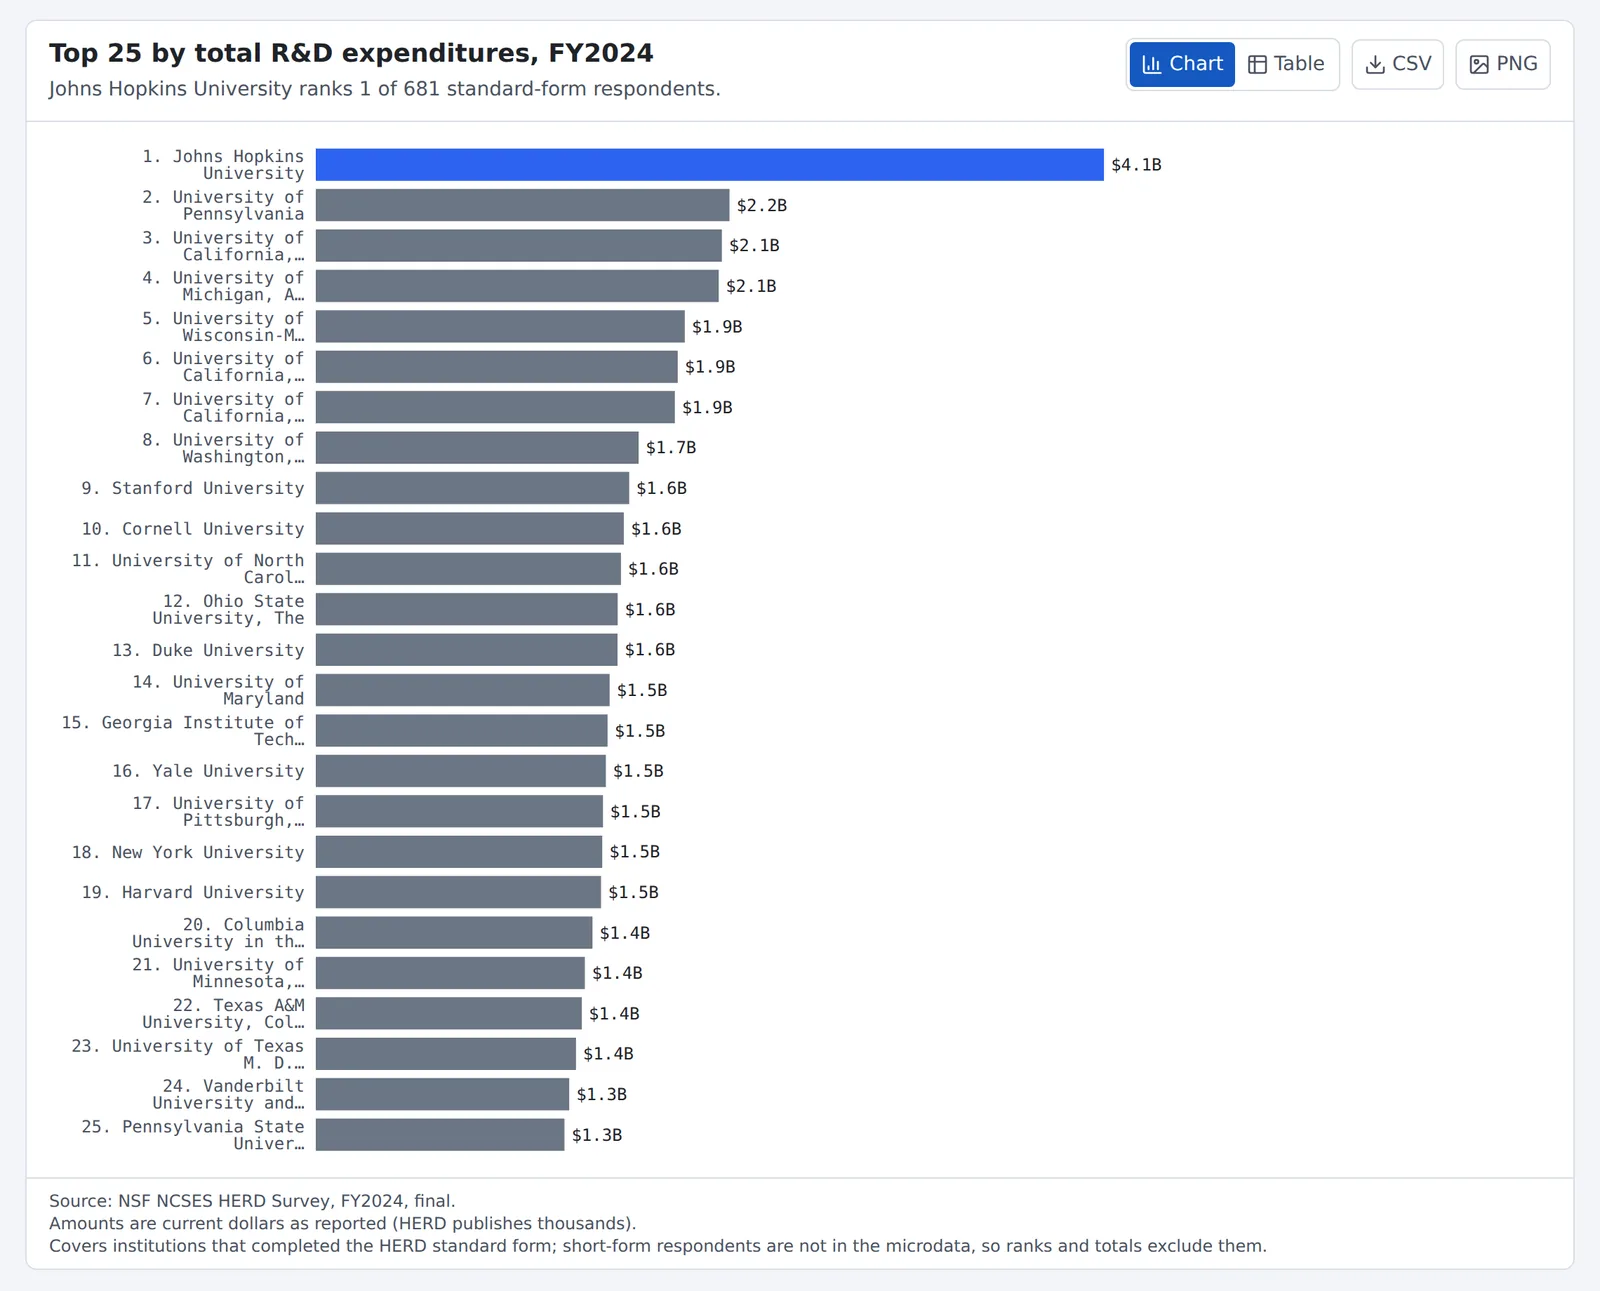
About the status labels. “Working preview” means the dashboards are built and running on sample data while we verify them. “In design” means the module is specified and in development; its previews on this page are drawn from the design, on sample data. Ask us which modules are ready for your institution.
See where AdiHub fits your institution.
Tell us which offices and systems are involved. We reply within three business days.